6.6 vLLM distributed deployment in practice
Against vLLM v0.32.0, deploy Llama-3.1-70B on one 8-GPU machine in TP8, TP4×PP2, and TP4×DP2: estimate memory before launch, check KV capacity from logs and metrics after, sweep concurrency with vllm bench serve under the same load, and use DCP to remove long-context KV replication
The first five sections covered the principles of each parallel mode and how to start multi-node. This section puts them on the same machine and compares: one 8-GPU box, the same Llama-3.1-70B, deployed three ways—TP=8, TP=4 × PP=2, TP=4 × DP=2—and measures how KV capacity, latency, and throughput differ.
Four steps: estimate how memory splits before launch, check the estimate from logs after launch, sweep concurrency with vllm bench serve under the same load, then fold into a comparison table. Commands follow vLLM v0.32.0 docs and source. GPU experiments must run in your own environment; this text does not fill in unmeasured scores. The last part covers Decode Context Parallel (DCP), which removes KV replication once TP exceeds KV head count.
⏰ Currency: Based on vLLM v0.32.0 (released 2026-10-18) docs and source. Log formats from
vllm/v1/core/kv_cache_utils.pyandvllm/v1/worker/gpu_worker.py; Benchmark flags fromvllm/benchmarks/serve.pyandvllm/benchmarks/datasets/datasets.py.
📑 Contents
- 1. Fix the environment and the control variables
- 2. Estimate before launch: how memory splits
- 3. Launch commands for the three layouts
- 4. Check after launch: logs, memory, metrics
- 5. Performance compare: sweep concurrency under the same load
- 6. Long context: remove KV replication with DCP
- 7. Choose, tune, and troubleshoot
- Summary
- Self-check list
- References
1. Fix the environment and the control variables
1.1 Install and record versions
As in section 5.5, install a pinned version in an isolated env and archive the environment:
python -m venv .venv
source .venv/bin/activate
python -m pip install 'vllm[bench]==0.32.0'   # bench subcommand needs extra deps
mkdir -p results
python -m pip freeze > results/environment.txt
nvidia-smi > results/nvidia-smi.txt
nvidia-smi topo -m > results/topo.txt         # confirm the 8 cards are on NVLink
vllm serve --help=all > results/serve-help.txt
In the nvidia-smi topo -m matrix, NV<number> between GPUs means NVLink; PIX, PXB, SYS, etc. mean PCIe or cross-CPU. Without NVLink, TP=8 AllReduce is much slower and this section’s conclusions do not apply directly (section 6.2).
1.2 Change only the parallel mode
The model is meta-llama/Llama-3.1-70B-Instruct, matching earlier estimates: 80 layers, 8 KV heads, about 141 GB BF16 weights. It is a gated repo—request access early, download to local disk, and pass a local path at start.
| 📊 Fixed item | This example | Why |
|---|---|---|
| Hardware | One 8 × H100 80GB (NVLink) | All three layouts use all 8 cards |
| Model / dtype | Llama-3.1-70B-Instruct, BF16 | No quantization variable mixed in |
| Context & memory | --max-model-len 8192, --gpu-memory-utilization 0.90 | Same KV-budget accounting |
| Schedule caps | Service-wide at most 128 concurrent sequences; each engine --max-num-batched-tokens 8192 | See section 3 for the DP conversion |
| Prefix Cache | Off | Random inputs rarely hit; off is easier to explain |
| Load | Random input 2048 tokens, fixed output 256 tokens | Same work per group |
📌 Key point: Change only parallel flags each time. If you also change --max-model-len or the memory fraction, you cannot tell where the difference came from.
2. Estimate before launch: how memory splits
2.1 The ledger for three layouts
Before launch, run the numbers so you know roughly how much KV each layout holds and can judge whether the log figures look right. The script only does arithmetic; no GPU needed:
# Pre-launch estimate: per-card weight, per-card per-token KV, and service-level
# KV capacity for three layouts on one 8-GPU machine.
# GPU_GIB and OVERHEAD_GIB are assumptions; edit from your nvidia-smi and launch logs
GPU_GIB = 79.6                 # total memory per card from nvidia-smi memory.total
UTIL = 0.90                    # --gpu-memory-utilization
OVERHEAD_GIB = 3.0             # activations, CUDA Graph, comm buffers, etc.; assumed
WEIGHT_GIB = 70.6e9 * 2 / 2**30
LAYERS, KV_HEADS, HEAD_DIM = 80, 8, 128   # Llama-3.1-70B

LAYOUTS = {                    # name: (TP, PP, DP)
    "TP8":     (8, 1, 1),
    "TP4×PP2": (4, 2, 1),
    "TP4×DP2": (4, 1, 2),
}
print(f"{'layout':<8} {'wt/GPU GiB':>11} {'KV KiB/tok/GPU':>17} {'pools':>4} {'tok/pool':>10} {'tok total':>10}")
for name, (tp, pp, dp) in LAYOUTS.items():
    weight = WEIGHT_GIB / (tp * pp)
    heads = max(KV_HEADS // tp, 1)                          # at least 1 head/card once TP exceeds KV heads
    kv_per_token = (LAYERS // pp) * heads * HEAD_DIM * 2 * 2  # K and V each; BF16
    budget = (GPU_GIB * UTIL - weight - OVERHEAD_GIB) * 2**30
    per_pool = int(budget / kv_per_token)
    print(f"{name:<9} {weight:>11.1f} {kv_per_token / 1024:>18.0f} {dp:>5} {per_pool:>11,} {per_pool * dp:>11,}")
Output:
layout          wt/GPU GiB   KV KiB/tok/GPU  pools   tok/pool   tok total
TP8              16.4                 40     1   1,368,448   1,368,448
TP4×PP2          16.4                 40     1   1,368,448   1,368,448
TP4×DP2          32.9                 80     2     468,770     937,540
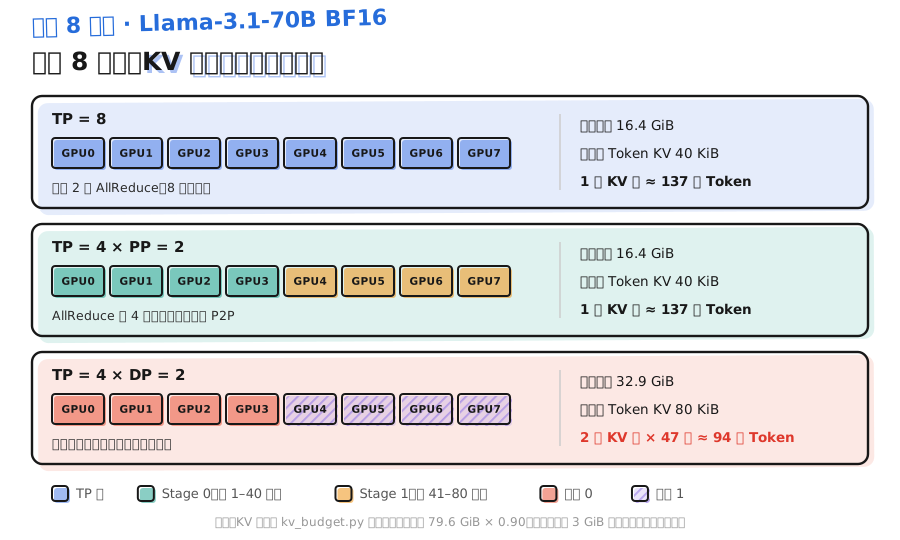
The figure draws the three layouts together; color marks which group a GPU belongs to; the right side is the script’s numbers:
2.2 What the ledger says
- TP8 and TP4×PP2 have the same capacity. Both spread one full weight set and each token’s KV across 8 cards: TP8 is 1 KV head × 80 layers per card; TP4×PP2 is 2 KV heads × 40 layers; the product is the same 40 KiB. They differ in speed, not capacity.
- TP4×DP2 total capacity is about one third lower. Each replica uses only 4 cards for a full weight set, so each card holds 16.4 GiB more weight and less room for KV.
- DP capacity sits in two pools. A request can only use the KV of its replica; max context for one request is set by each pool’s ~0.47M, not the combined ~0.94M. This example’s 8192 cap is far below both, so it does not matter here.
OVERHEAD_GIB is assumed; different CUDA Graph setups and batch caps change it. The estimate is for order of magnitude; section 4 replaces it with the real value from the launch log.
3. Launch commands for the three layouts
3.1 Shared flags
As in section 5.5, put shared flags in a Bash array; the three groups only append parallel flags:
MODEL=/models/Llama-3.1-70B-Instruct    # local path, downloaded ahead
COMMON=(
  --served-model-name llama70b
  --host 127.0.0.1
  --port 8000
  --dtype bfloat16
  --max-model-len 8192
  --max-num-batched-tokens 8192
  --gpu-memory-utilization 0.90
  --no-enable-prefix-caching
  --seed 42
)
3.2 Group A: TP=8
vllm serve "$MODEL" "${COMMON[@]}" \
  --tensor-parallel-size 8 \
  --max-num-seqs 128 \
  2>&1 | tee results/tp8-serve.log
3.3 Group B: TP=4 × PP=2
vllm serve "$MODEL" "${COMMON[@]}" \
  --tensor-parallel-size 4 \
  --pipeline-parallel-size 2 \
  --max-num-seqs 128 \
  2>&1 | tee results/tp4pp2-serve.log
At PP=2 the engine keeps 2 batches in the pipeline at once (section 6.3). --max-num-seqs caps the total requests across all in-flight batches, so it stays 128. 80 layers at PP=2 default to an even 40,40; only when layers do not divide evenly does vLLM print Hidden layers were unevenly partitioned and the actual split.
3.4 Group C: TP=4 × DP=2
vllm serve "$MODEL" "${COMMON[@]}" \
  --tensor-parallel-size 4 \
  --data-parallel-size 2 \
  --max-num-seqs 64 \
  2>&1 | tee results/tp4dp2-serve.log
Here --max-num-seqs becomes 64. Section 6.4 said this flag is per DP rank; 64 per replica makes the service-wide cap 128, same as A and B. --max-num-batched-tokens is also per engine, so two replicas together can process up to 16384 tokens per step—the natural result of DP having one scheduler each; just record that clearly.
vLLM docs prefer two independent Dense instances behind a load balancer. For this A/B test --data-parallel-size 2 keeps one port so the Benchmark command need not change; in production you can switch to two instances:
# Two independent instances, 4 GPUs and one port each
CUDA_VISIBLE_DEVICES=0,1,2,3 vllm serve "$MODEL" --tensor-parallel-size 4 --port 8000 ...
CUDA_VISIBLE_DEVICES=4,5,6,7 vllm serve "$MODEL" --tensor-parallel-size 4 --port 8001 ...
⚠️ Note: Run the three groups in sequence. After each, stop with Ctrl+C, confirm with nvidia-smi that all 8 cards freed memory, then start the next.
4. Check after launch: logs, memory, metrics
4.1 Three launch-log lines
After the model loads and CUDA Graph capture finishes, find these lines:
grep -E "Model loading took|Available KV cache memory|KV cache size" results/tp8-serve.log
| 📊 Log | Who prints | What to check |
|---|---|---|
Model loading took X GiB memory and Y seconds | Once per EngineCore, from local rank 0’s Worker | Weight memory on this card vs section 2’s per-card weight |
Available KV cache memory: X GiB | Once per EngineCore, from local rank 0’s Worker | Real KV budget on this card; use it to replace OVERHEAD_GIB in the estimate |
GPU KV cache size: N tokens, Maximum concurrency for 8,192 tokens per request: Mx | Once per EngineCore | How many tokens this engine’s KV pool holds, and how many full-length requests fit at once |
The concurrency multiplier on the last line is KV-pool tokens ÷ --max-model-len. Per section 2’s estimate, A and B should be around 167×; C about 57× per engine. C has two EngineCores and prints two lines; add them for service-wide capacity.
When real values diverge a lot from the estimate, look at Available KV cache memory first: smaller than estimated means activations or CUDA Graph took more than assumed; if per-card weight mismatches the estimate, check whether dtype and parallel flags actually took effect. Group B’s first stage has Embedding and last has LM Head, so stage weights differ slightly; those two log lines only come from local rank 0 (first card of the first stage), so you see the first stage’s numbers.
4.2 nvidia-smi only shows totals
nvidia-smi --query-gpu=index,memory.used,memory.total --format=csv
vLLM pre-allocates KV space at start to --gpu-memory-utilization, so all three groups show memory.used near 90% of total—you cannot see how much is weight vs KV. This step only confirms all 8 cards are in use and none sit idle; weight/KV split comes from the 4.1 logs.
4.3 Metrics while running
During the load test, open another terminal and poll /metrics:
curl -s http://127.0.0.1:8000/metrics \
  | grep -E '^vllm:(kv_cache_usage_perc|num_requests_running|num_requests_waiting|num_preemptions_total)'
| 📊 Metric | Meaning |
|---|---|
vllm:kv_cache_usage_perc | KV pool occupancy; 1 means 100% |
vllm:num_requests_running / vllm:num_requests_waiting | Running and waiting request counts |
vllm:num_preemptions_total | Cumulative preemptions; take the delta across the load test |
These metrics carry an engine label. Group C shows engine="0" and engine="1"; you can see whether the two replicas are balanced. The service log also prints Running: N reqs, Waiting: N reqs ... KV cache usage: X% every 10 seconds by default (VLLM_LOG_STATS_INTERVAL); on preemption it adds a Preemptions: N segment.
📌 Key point: Non-zero preemptions during the load test mean KV ran out and that group’s latency includes recompute cost. Record the preemption count with the results.
5. Performance compare: sweep concurrency under the same load
5.1 Run the Benchmark in another terminal
Set LABEL to the name of the group currently serving, then sweep four concurrency levels:
LABEL=tp8   # after switching the service, use tp4pp2 / tp4dp2
for C in 1 16 64 128; do
  N=$(( C * 8 > 64 ? C * 8 : 64 ))   # at least 64 prompts per level; ~8 per concurrency slot at high C
  vllm bench serve \
    --backend openai \
    --base-url http://127.0.0.1:8000 \
    --endpoint /v1/completions \
    --model llama70b \
    --tokenizer "$MODEL" \
    --dataset-name random \
    --random-input-len 2048 \
    --random-output-len 256 \
    --num-prompts "$N" \
    --num-warmups 8 \
    --max-concurrency "$C" \
    --request-rate inf \
    --temperature 0 \
    --ignore-eos \
    --seed 42 \
    --percentile-metrics ttft,tpot,itl \
    --metric-percentiles 50,99 \
    --metadata layout="$LABEL" gpus=8 \
    --save-result \
    --result-dir results \
    --result-filename "${LABEL}-c${C}.json"
done
What a few flags do:
--dataset-name randombuilds inputs from the Tokenizer at random;--seed 42gives all three groups the same prompt set.--random-range-ratiostays at the default 0, so every request has fixed input and output lengths.--ignore-eosmakes every request generate the full 256 tokens so work matches across groups.--max-concurrencycaps how many requests sit on the server at once;--request-rate infmeans as soon as one finishes the next is sent. That measures latency and throughput at a given concurrency.--metadatawrites the layout name and GPU count into top-level JSON fields the summary script will use.
Concurrency 128 equals the service-wide --max-num-seqs. Going higher only queues on the server; TTFT grows and throughput does not.
5.2 Summarize results
After all three groups finish, fold the 12 JSONs into one table. Field names follow v0.32.0 vllm/benchmarks/serve.py: percentile fields are p{percentile}_{metric}_ms; throughput is output_throughput (output Token/s).
# Summarize JSONs from vllm bench serve: one row per layout × concurrency;
# normalize throughput by GPU count
import json
from pathlib import Path

rows = [json.loads(p.read_text()) for p in Path("results").glob("*-c*.json")]
rows.sort(key=lambda r: (r["layout"], r["max_concurrency"]))
print(f"{'layout':<8} {'conc':>4} {'ok/fail':>8} {'TTFT p50':>9} {'TTFT p99':>9} "
      f"{'TPOT p50':>9} {'TPOT p99':>9} {'out tok/s':>10} {'tok/s/GPU':>10}")
for r in rows:
    gpus = int(r["gpus"])                          # from --metadata gpus=8
    print(f"{r['layout']:<8} {r['max_concurrency']:>4} {r['completed']:>4}/{r['failed']:<3} "
          f"{r['p50_ttft_ms']:>9.0f} {r['p99_ttft_ms']:>9.0f} "
          f"{r['p50_tpot_ms']:>9.1f} {r['p99_tpot_ms']:>9.1f} "
          f"{r['output_throughput']:>10.0f} {r['output_throughput'] / gpus:>10.0f}")
If failed is not 0, check the service log first; that row’s throughput is not comparable to the others.
5.3 Record table
Put the script output and section 4’s checks in one table. The table below only lists what to record; fill numbers from your runs:
| 📊 Record | TP8 | TP4×PP2 | TP4×DP2 |
|---|---|---|---|
Weight per card (Model loading took) | measured | measured | measured |
Service-wide KV tokens (GPU KV cache size; sum both DP lines) | measured | measured | measured |
| Concurrency-1 TPOT p50 / p99 | measured | measured | measured |
| Concurrency-128 TTFT p99, TPOT p99 | measured | measured | measured |
| Output Token/s at each concurrency | measured | measured | measured |
| Preemption delta across the load test | measured | measured | measured |
Repeat each group at least 3 times and watch the spread. If the gap between two groups is smaller than within-group noise, do not conclude “which is faster”.
5.4 Read results against hypotheses
Section 6.3’s cost model predicted for the first two groups: inside one machine, TP4×PP2 is slower than TP8 at every concurrency, because PP splits requests into small batches and each small batch fully reads that stage’s weights. Group C is outside that model; write a few hypotheses first, then confirm or reject with measurement:
- At concurrency 1, C’s TPOT is higher than A’s. One request lands on one replica; the other 4 cards idle; that replica reads 32.9 GiB weight per card—twice TP8.
- At high concurrency, C’s throughput may catch or pass A. No communication between replicas, and TP=4 AllReduce has fewer participants than TP=8; but each replica’s batch is only half as large, so weight reads amortize less. Which factor wins is measurement-only.
- As long as KV fits, C’s capacity disadvantage does not show in throughput. This example: 64 requests per replica, ~2300 tokens each max, far under each pool’s ~0.47M estimate. On long-context load, C preempts earlier.
💡 Tip: Write conclusions with the load. “At concurrency 128, input 2048, output 256, C has higher throughput” is retestable; “DP is better than TP” is not.
6. Long context: remove KV replication with DCP
6.1 After TP exceeds KV head count
Section 6.2 said that once a GQA model’s TP exceeds KV head count, vLLM replicates KV heads onto multiple cards and per-card KV stops shrinking with TP. The replication factor is tp_size / H ( = KV heads). At short context that waste is fine; at long context KV fills memory and the batch cannot grow.
Decode Context Parallel (DCP) cuts on another axis: tokens of the same KV head are split across several cards. It does not add GPUs; it reuses cards in the TP group that already held duplicate KV. vLLM docs have a ready example: Qwen3-235B-A22B has 4 KV heads; -tp 8 stores each KV head twice; adding -dcp 2 removes the duplication.
The figure shows only head 0’s 8 tokens. Top half is -tp 8: GPU0 and GPU1 store identical content. Bottom half adds -dcp 2: cyan is even tokens on GPU0, orange odd tokens on GPU1; gray dashed cells are the space saved:
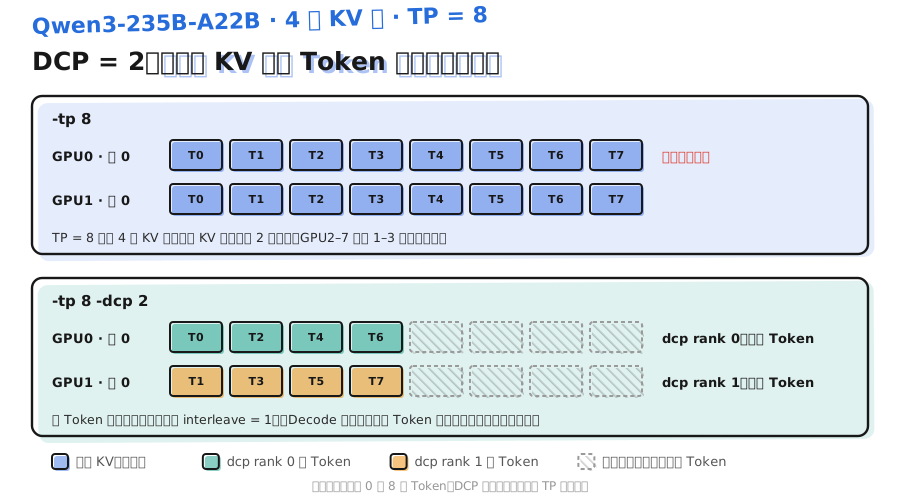
Tokens are assigned interleaved: default --cp-kv-cache-interleave-size 1, token lives on dcp rank . Newly decoded tokens then naturally rotate across cards. Each Decode step, cards first compute partial attention on their local tokens, then communicate inside the DCP group to merge—that communication is DCP’s cost.
6.2 Parameter constraints
DCP is enabled with --decode-context-parallel-size (short -dcp), default 1. v0.32.0 checks these at start (vllm/config/parallel.py, vllm/config/model.py) and errors if they fail:
| 📊 Constraint | Models | Error if violated |
|---|---|---|
| TP divisible by DCP | All | tp_size=... must be divisible by dcp_size=... |
| TP greater than total KV heads | GQA / MQA | Decode context parallelism for GQA/MQA requires --tensor-parallel-size (...) to be greater than the model's total number of KV heads |
| DCP ≤ TP ÷ KV heads | GQA / MQA | --decode-context-parallel-size (...) exceeds the maximum supported value |
| Q heads per KV head divisible by DCP | GQA / MQA | The model's number of query heads per KV head (...) must be divisible by --decode-context-parallel-size |
MLA models cache one latent vector—effectively 1 KV head—and are not bound by the last three. Doc examples:
| 📊 Model | KV heads | Deploy | Replication | DCP suggestion |
|---|---|---|---|---|
| DeepSeek-R1 (MLA) | 1 | -tp 8 | 8 | -dcp 8 |
| Kimi-K2 (MLA) | 1 | -tp 16 (two machines) | 16 | -dcp 16 removes all; -dcp 8 leaves 2× but DCP comm stays in-node |
| Qwen3-235B-A22B | 4 | -tp 8 | 2 | -dcp 2 |
Back to this section’s Llama-3.1-70B: 8 KV heads, at TP=8 each card owns exactly one head—no replication—so -dcp 2 triggers the second error above. Only with two machines and -tp 16 do you get 2× replication, and DCP maxes at 2. So the first five parts’ experiments do not use DCP.
6.3 One A/B comparison
Compare -tp 8 vs -tp 8 -dcp 2 for Qwen3-235B-A22B on one 8-GPU machine. BF16 weights are about 470 GB, ~59 GB per card; 8× H100 80GB leave little for KV—H200-class cards with more memory are more comfortable. Aside from -dcp, the two groups match:
QWEN=/models/Qwen3-235B-A22B   # local path
LONG=(
  --served-model-name qwen235b --host 127.0.0.1 --port 8000
  --max-model-len 32768 --gpu-memory-utilization 0.90
  --no-enable-prefix-caching --seed 42
  --tensor-parallel-size 8
)
vllm serve "$QWEN" "${LONG[@]}"                  2>&1 | tee results/qwen-tp8.log
vllm serve "$QWEN" "${LONG[@]}" -dcp 2           2>&1 | tee results/qwen-tp8-dcp2.log   # stop the previous group first
After launch, compare logs first:
grep -E "Available KV cache memory|KV cache size" results/qwen-tp8*.log
Per-card Available KV cache memory should be about the same; what changes is GPU KV cache size token count. At DCP=2 each card stores half the tokens, so the same memory should hold nearly twice as many tokens; trust the log for the factor. In source, one KV Block under DCP represents block_size × dcp tokens, so convert Block count to tokens by multiplying by DCP when reading monitors.
Then load-test with long inputs across a few concurrency levels:
mkdir -p results/qwen   # keep separate from section 5 so the summary glob does not pick these up
for C in 8 32 64; do
  vllm bench serve --backend openai --base-url http://127.0.0.1:8000 \
    --endpoint /v1/completions --model qwen235b --tokenizer "$QWEN" \
    --dataset-name random --random-input-len 16384 --random-output-len 512 \
    --num-prompts $(( C * 4 )) --max-concurrency "$C" --request-rate inf \
    --ignore-eos --seed 42 --percentile-metrics ttft,tpot --metric-percentiles 50,99 \
    --metadata layout="$LABEL" --save-result --result-dir results/qwen \
    --result-filename "${LABEL}-c${C}.json"
done
Set LABEL to tp8 and tp8dcp2. When reading results, watch two things:
- Preemption and queues. When KV is short, the
-tp 8group first growsnum_preemptions_totaland pilesnum_requests_waiting; high-concurrency throughput stalls. The DCP group has more KV and can run more requests at once. - Low-concurrency TPOT. When KV fits either way, DCP’s extra in-group communication is pure overhead; TPOT may be a bit higher than
-tp 8.
📌 Key point: DCP trades communication for KV space. Do not enable it when KV is not the bottleneck. Doc order of preference: raise TP until performance is good, then add DCP to remove replication.
⚠️ Note: In v0.32.0 DCP cannot pair with --enable-return-routed-experts. With NixlConnector for PD separation (Chapter 7), DCP > 1 only supports MLA models. DCP in-group communication defaults to AllGather + ReduceScatter (--dcp-comm-backend ag_rs; some models can change the default in code); MLA models can try a2a.
7. Choose, tune, and troubleshoot
7.1 Pick a layout by whether it fits
Walk this chapter’s conclusions in order:
- Fits on one card: do not cut; if throughput is short, open more independent instances behind a load balancer (section 6.4).
- Fits on one machine: take the smallest TP that holds weights and leaves enough KV; leftover cards become DP. This section’s TP4×DP2 and TP8 are two candidates in that band—measure with section 5’s method before deciding. Inside one machine you usually skip PP.
- Does not fit on one machine: TP = GPUs per node, PP = node count; keep TP groups in-node (sections 6.2, 6.5).
- MoE models: attention DP, experts EP; add
--enable-expert-paralleland a fitting--all2all-backend(section 6.4). - Long context, TP already past KV heads: add DCP to remove KV replication (section 6 here).
| 🎯 Goal | Preferred layout | Why |
|---|---|---|
| Single-request latency (low-concurrency TPOT) | Larger TP | Least weight each card must read |
| High-concurrency throughput | Smallest TP that fits + DP | Less communication, zero sync between replicas; measure to confirm |
| Longest context one request can use | Larger TP, DCP if needed | DP KV sits in multiple pools; one request uses only one |
7.2 Tuning checklist
- Set
--max-model-lenfirst. It decides how much KV a full-length request takes and the max concurrency multiplier in the launch log. Setting it far above business need only makes the scheduler more conservative. - Tune
--gpu-memory-utilizationfrom measurement. This section fixed 0.90 for a fair comparison. In production, look atAvailable KV cache memoryand peak memory; leave only the headroom you need. - Under DP, convert
--max-num-seqsby replica count. It is a per-DP-rank cap;--max-num-batched-tokensis also per engine. - Turn Prefix Cache on in production. This section turned it off so random-load results stay explainable; traffic with a shared System Prompt usually benefits from leaving it on.
- After every flag change, rerun the same Benchmark set. Archive results with the environment info from section 1 (
environment.txt,topo.txt) so you can rewind later.
7.3 Common issues
| ❓ Symptom | Likely cause | Fix |
|---|---|---|
GPU KV cache size far below estimate | Activations / CUDA Graph took more than assumed, or dtype / parallel flags did not take effect | Cross-check Model loading took and Available KV cache memory line by line (section 4) |
num_preemptions_total grows during the load test | KV short; preempted requests recompute | Lower concurrency or --max-model-len, raise TP, consider DCP for long context |
One DP engine has clearly more running than the other | Large length skew; two replicas unbalanced | Inspect /metrics by engine label; with independent instances, check the load-balance policy |
| TP4×PP2 much slower than TP8 at low concurrency | Too few in-flight batches; every stage fully reads weights | Prefer TP inside one machine; leave PP for cross-node |
Start error Decode context parallelism for GQA/MQA requires ... | TP not greater than KV heads; nothing to remove | Drop -dcp, or raise TP |
Start error ... exceeds the maximum supported value | DCP above TP ÷ KV heads | Lower DCP to at most that value |
| Multi-node slower than single-node | NCCL fell back to NET/Socket | Check IB and GPUDirect RDMA per section 6.5 part 6 |
📝 Summary
- In a controlled experiment change only parallel flags; keep
--max-model-len, memory fraction, schedule caps, and load fixed. Under DP, convert--max-num-seqsby replica count. - Before launch estimate per-card weight and per-token KV: on one 8-GPU machine TP8 and TP4×PP2 share the same KV capacity (~1.37M tokens); TP4×DP2 is about one third lower (two pools ~0.47M each).
- After launch check the estimate with the three log lines
Model loading took,Available KV cache memory, andGPU KV cache size;nvidia-smionly confirms every card is in use. - Sweep concurrency with
vllm bench serveat fixed input/output lengths,--ignore-eos, and the same seed; save results with--metadataas JSON and summarize together; also record preemptions. - Write hypotheses before the experiment and verify with data after; attach load conditions to conclusions; do not conclude when between-group gaps are smaller than within-group noise.
- Once TP exceeds KV heads, DCP shards KV along the token axis and reuses cards inside the TP group to remove replication; it needs TP > KV heads and DCP ≤ TP ÷ KV heads, at the cost of in-group communication.
🎯 Self-check list
- Can list the variables a controlled experiment must fix, and how to convert
--max-num-seqsunder DP - Can hand-compute Llama-3.1-70B per-card weight and per-token KV under TP8, TP4×PP2, and TP4×DP2, and explain why the first two have the same capacity
- Can find weight memory, available KV memory, and KV token count in the launch log and use them to correct the estimate
- Can write a
vllm bench servecommand that, at fixed concurrency, reports TTFT/TPOT p50/p99 and output throughput - Can use
/metricsto tell whether preemption happened during the load test and whether DP replicas are balanced - Can decide from a model’s KV head count and TP whether DCP is usable and what its max is
- Can pick candidate layouts for a model from “does it fit” plus latency/throughput goals, and design a verification experiment
📚 References
- vLLM docs: vllm bench serve
- vLLM docs: Production Metrics
- vLLM docs: Optimization and Tuning
- vLLM docs: Context Parallel Deployment
- vLLM docs: Data Parallel Deployment
- vLLM source: vllm/benchmarks/serve.py (v0.32.0)
- vLLM source: vllm/v1/core/kv_cache_utils.py (v0.32.0)
- vLLM source: vllm/v1/worker/gpu_worker.py (v0.32.0)
- vLLM source: vllm/config/model.py (v0.32.0, DCP constraint checks)
- Helix Parallelism: Rethinking Sharding Strategies for Interactive Multi-Million-Token LLM Decoding
- The Llama 3 Herd of Models
- Qwen3 Technical Report